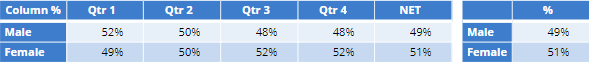
This article describes how to go from tables that show all data...
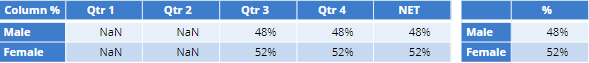
...to tables that only show data for the last 2 periods, for example:
Requirements
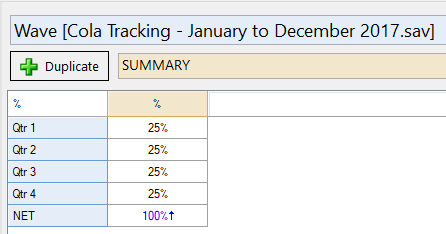
A data set that includes a Pick One wave variable. In this example, we have a variable called Wave that tells us what quarter the survey was completed. Regardless of how they are coded, waves must be in ascending order when shown in a table like:
Method
1. On the Variables and Questions tab, right click and select Insert Variable(s) > R Variable.
2. Paste the below under R CODE:
#Get the wave categories
unique.waves = levels(Wave)
#Identify last 2 waves in the list of unique waves
last.two.waves = unique.waves[(length(unique.waves)-1):length(unique.waves)]
#Return TRUE/FALSE if the Wave of a response is in the last two waves
Wave %in% last.two.waves
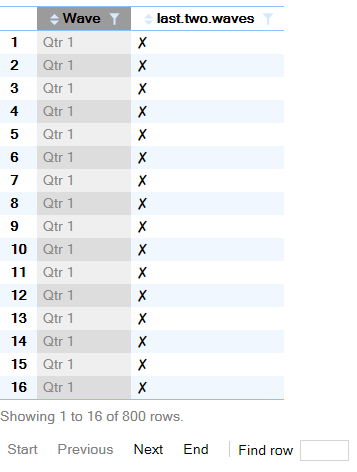
3. Click the play button to run the code and review the results. The grey column is the input data (Wave) and the blue column on the right is the result of what will be filtered in. TRUEs are checks and FALSEs are Xs.
4. Give it a Question Name.
5. Click Add R Variable.
6. Click the F in the Tags column to make this variable a filter and available in the Filter(s) dropdown for your Report.
Next
How to Filter Raw Data Using R
How to Create a Custom R Variable