Introduction
This article will tell you how to edit a line chart visualization so that it shows a moving (rolled) average.
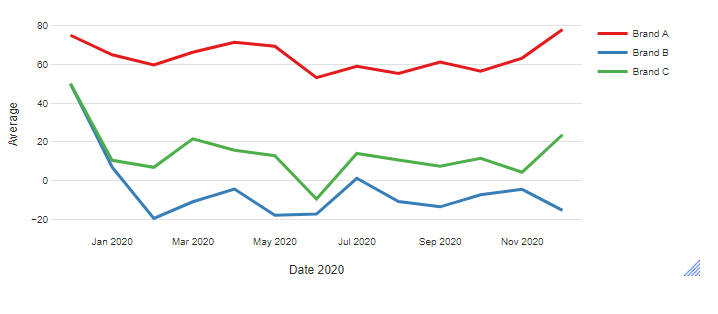
It will take you from a visualization that looks like this:
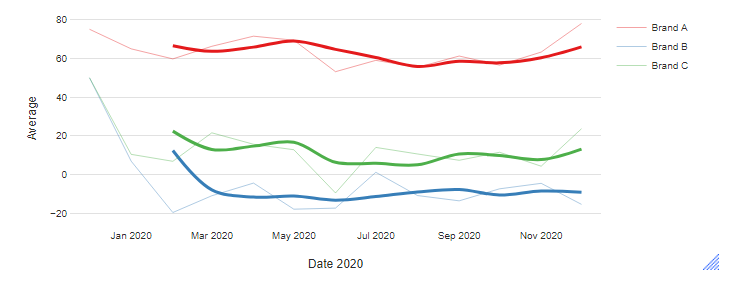
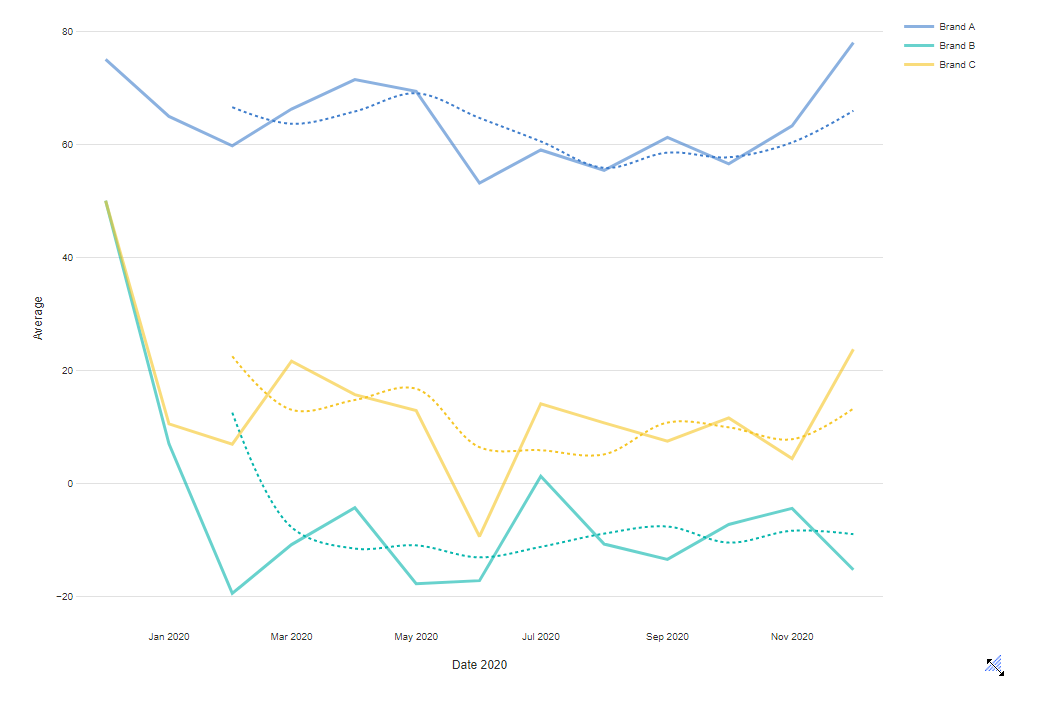
To a visualization that looks like this:
Requirements
- A line chart made using the function Create > Charts > Visualization > Line > Line should already be made and present. For instructions on how to make a line chart, see How to Create a Line Chart Visualization from a Table.
Method
The basic steps simply add the moving average line to the chart:
- Create a crosstab with the date variable or moving average Pick Any question in the brown drop-down menu of the crosstab.
- From the toolbar, select Charts > Visualization > Line > Line. and select the crosstab table from the Output tree.
- Click Calculate (if you do not have the Automatic box checked)
- In the Object Inspector on the right, select Chart > Trend Lines > Line of best fit > Moving Average.
Next
How to Compute a Moving Average