Introduction
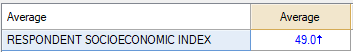
This article describes how to compute percentiles from a table of a Number variable like this:
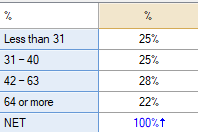
To a table showing percentiles:
Requirements
A Number question that you want to convert into percentiles
Method
This example considers quartiles (i.e. 25th, 50th, 75th percentiles), but other percentiles can be generated by changing the number of categories specified.
- Create a table with the Number question selected in the Blue drop-down menu, and SUMMARY selected in the Brown.
- Select Show Data As and choose Histogram.
- Below the histogram, select Create Categories.
- Change the number of Categories to 4. This number is appropriate for quartiles. For deciles (10th, 20th, 30th, etc. percentiles) instead enter 10. Or, manually drag the red lines about to create any percentile of interest.
- Select Make Equal Proportions.
- From the toolbar, select Create > Tables > Table
- Show the new question called Histogram Categories - <Your question name> in the Blue drop-down menu. This question is generated at the time you create categories from the Histogram.
- Rename the labels (if desired):
- 25th Percentile
- 50th Percentile
- 75th Percentile
- 100th Percentile
The categories of the question contain respondents in the percentiles of the original question. This question depends upon the histogram, so do not remove or modify the histogram further.
Next