Introduction
This article describes the basics for creating tables in Q. Click the links at the end of article for information on how to control the appearance of tables by changing the underlying data; creating lots of tables at the same time; and other options for changing the appearance of tables.
The basics
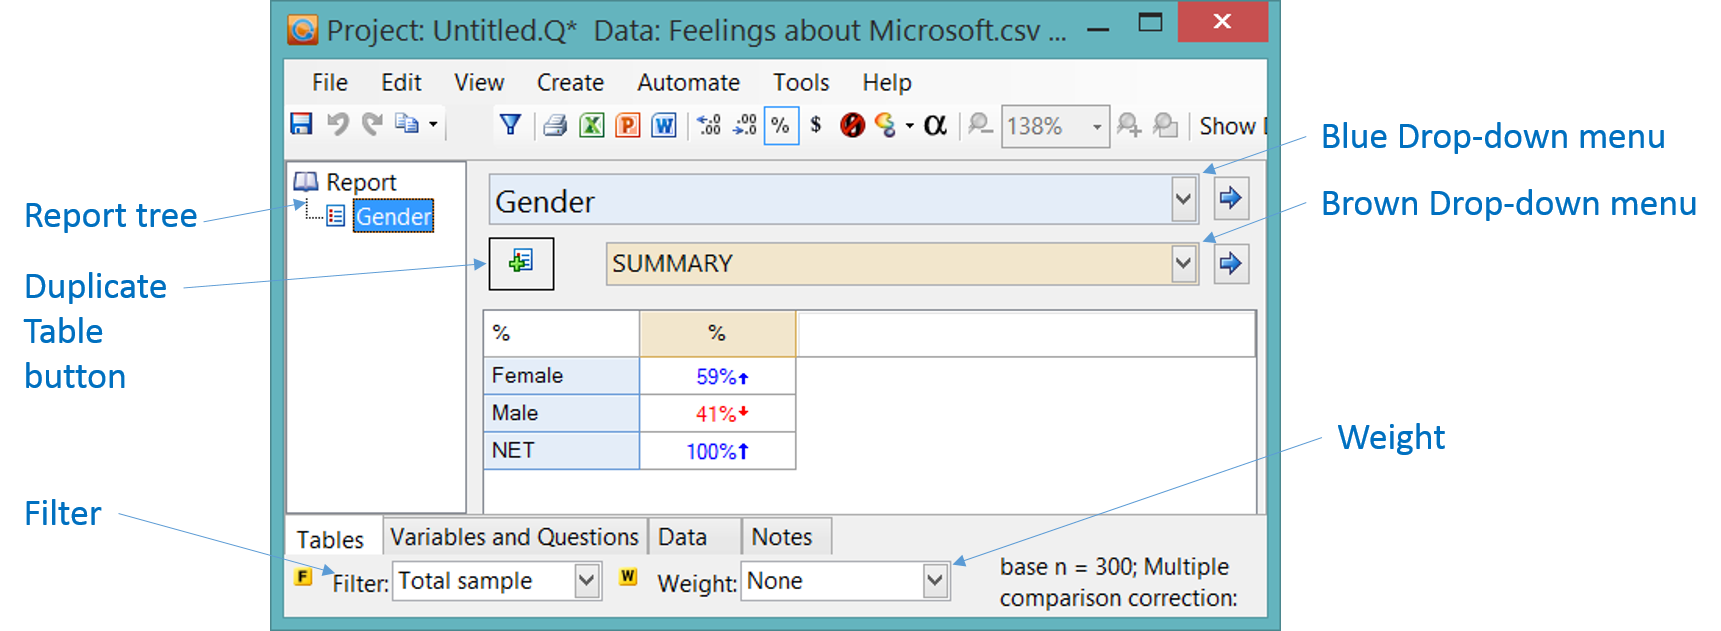
As soon as you have set up your data in Q, Q automatically creates a SUMMARY table of the first Question in the study. You can then:
- Change which Question is selected in the Blue and Brown Drop-down Menus. You can do this by either pressing on
 or typing directly into the dropdowns.
 - Apply Weights and Filters
- Select which statistics you wish to view on the table, such as n, Column % and Index, in the cells of the table, to its right or underneath.
- Add further tables to Report tree by press the Duplicate Table button (
 ).
).

Controlling the appearance of tables by changing the underlying data
Many of the most fundamental ways of controlling tables are done by changing the underlying data. When you change the appearance of a table by changing its underlying data, all other tables using the same data will also change. If this is not desirable, you can instead create multiple versions of the data by duplicating the data).
The main ways of manipulating the data to change the appearance of tables are:
- Merging and moving rows and columns by dragging and dropping.
- Create NETs by selecting categories, right-clicking and select Create NET.
- Sorting.
- Creating Banner questions, which are hybrids of multiple questions (e.g., age and gender, or gender within age).
- Spans, which are sub-headings going across multiple categories.
- Recoding numeric values and changing missing data settings by right-clicking on rows/columns, selecting Values and modifying the Value Attributes.
- Moving and Changing Rows and Columns by dragging and dropping.
- Hiding rows and columns.
Other options for changing the appearance of tables
- Setting statistical assumptions.
- Using Rules to automatically modify formatting (e.g., automatically shading high values, automatically sorting each table from top to bottom).
- Format the cells of the table.
- Customizing the names the names of statistics on tables and charts (e.g., changing "Column n" to "Base").
- Changing the default appearance of tables.
- Changing the Table Styles in Project Options (this only changes the appearance of tables).
- Creating charts.
- Table JavaScript and Plot JavaScript can be used for more advanced customization of pages (see Customizing Rules for the general approach).
Creating lots of tables at the same time
You can manually create a report table-by-table using the procedures described above (see also Report for additional tools for organizing the report). Or, you can automatically create lots of tables, using any of:
- Basic Tables
- Smart Tables
- Preliminary Project Setup - Summary Tables
- Preliminary Project Setup - Summary Plots
- Tables - Crosstabs
- Tables - Banner Tables
How To Create and Modify Tables