Introduction
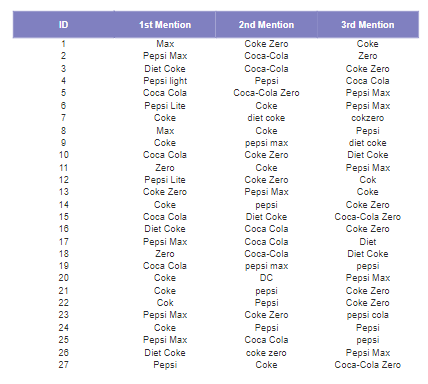
Sometimes you may need to add custom appendix tables or tables of raw data to your PowerPoint document. If you want to add very customized formatting to these tables you can create an Autofit or CreateCustomTable R Table, but these tables try to fit all of the data in the size of the output. This article describes how to go from an Autofit or CreateCustomTable R table where some of the data is cut off or too scrunched (note the below table actually has 600 rows):
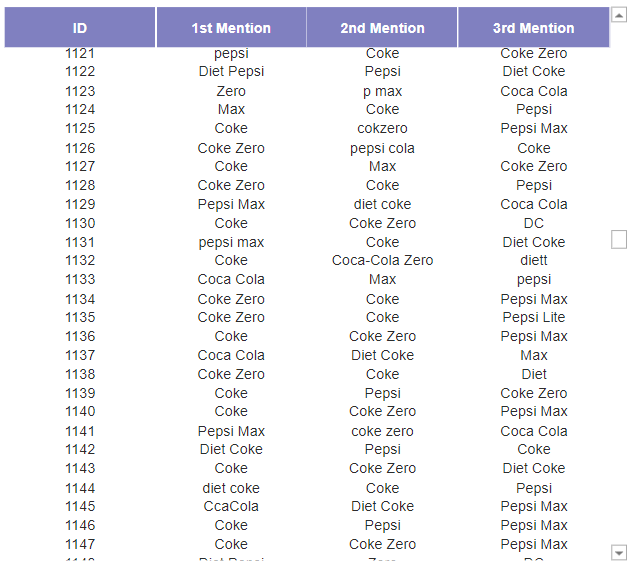
To one that has scrolling enabled:
Requirements
- An Autofit table or CreateCustomTable R Table (see How to Customize a Table using CreateCustomTable in R)
Method - Autofit table
- Create your Autofit table. Click Create > Tables > Enter Data.
- Selecting your table in Output.
- Check Autofit.
- Go to Properties > R CODE and use Ctrl+F to find the line of code for
row.header.labels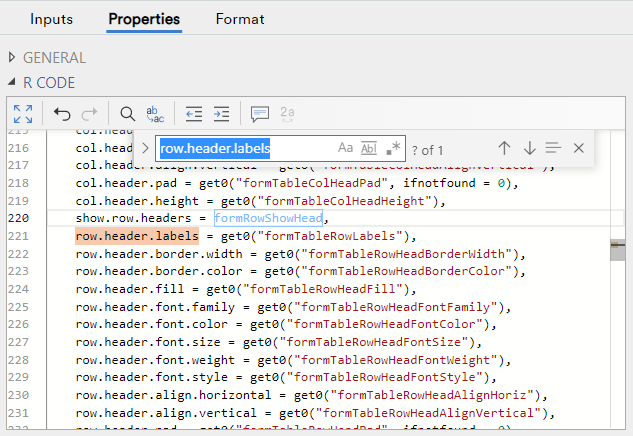
- Insert a line above and paste in code that sets a value for
row.height(note you can change 12px to a different px size based on the font size in your table):
row.height = "12px",
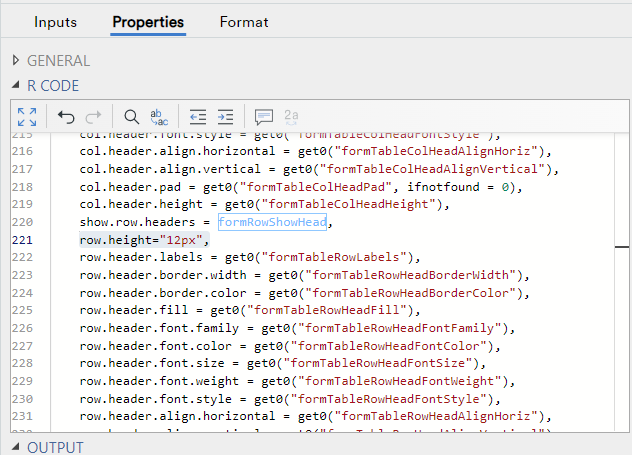
- Click Calculate.
Method - CreateCustomTable R Table
- Click on your R output.
- In the Properties > R CODE box, inside the flipFormat::CreateCustomTable() function, add a line for the
row.heightargument (note you can change 12px to a different px size based on the font size in your table). For example:
#specify what table you'd like to use
mytable = table.Q1a.Spontaneous.Awareness.Spontaneous.Awareness.mention

#Create the custom table adding in the row.height argument to create the scroll
flipFormat::CreateCustomTable(mytable,
row.height="12px") - Click Calculate.
Next
How to Customize a Table using CreateCustomTable in R
How to Customize Fonts in a CreateCustomTable R Table
How to Add Row Spans to a CreateCustomTable R Table
How to Add Column Spans to a CreateCustomTable R Table
How to Customize a Table with Multiple Statistics using CreateCustomTable in R
How to Add Statistical Significance to CreateCustomTable R Tables