Introduction
This article describes how to go from a standard table...
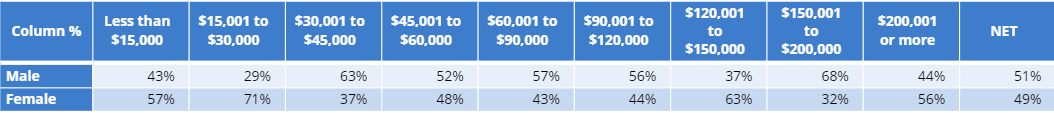
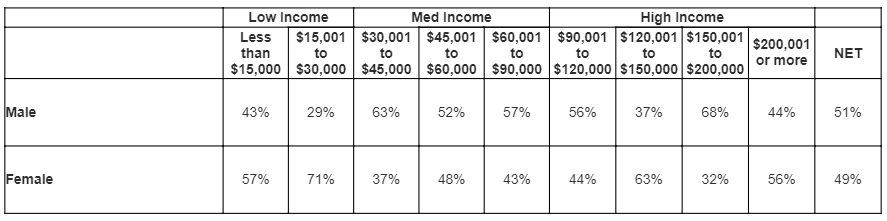
...to a CreateCustomTable R table (similar to a table with Autofit checked) with span column labels:
Requirements
A table.
Method
1. Select your table.
2. Copy the name from Properties > GENERAL > Name.
3. Right click on the Report tree and select Add R Output.
4. Paste the below under Properties > R CODE:
#identify mytable
mytable = table.Gender.by.Income
#create list of lists containing column spans
colspans = list(list(width=1,label=" "),
                list(width=2,label="Low Income"),
                list(width=3,label="Med Income"),
                list(width=4,label="High Income"),
                list(width=1,label=" "))
# #create custom table
flipFormat::CreateCustomTable(mytable,
                              col.spans=colspans,
                              border.color = "black")
- The above code defines the table using the reference name from step 2.
- Next, we create a list of the span labels where the width represents the number of columns the span should cover and the label is what should appear within the span.
- Finally, we use our CreateCustomTable function from the flipFormat R package and parse colspans into the col.spans argument.
5. Right click on the R Output and select Calculation Options.
6. Change Exporting > Format > To PowerPoint as Image of R Output. Note that this means you cannot edit the table once it is exported to PowerPoint.
7. OPTIONAL: Add other arguments to CreateCustomTable to set fill colors, padding and font styles.
Next
How to Customize a Table using CreateCustomTable in R
How to Customize Fonts in a CreateCustomTable R Table
How to Add Row Spans to a CreateCustomTable R Table
How to Customize a Table with Multiple Statistics using CreateCustomTable in R
How to Add Statistical Significance to CreateCustomTable R Tables