Introduction
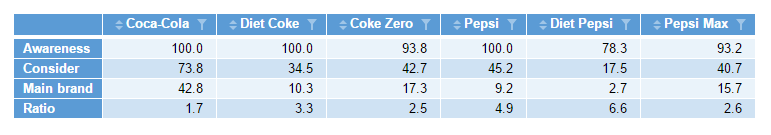
This article describes how to create a table that represents the concept of a brand funnel (similar to a purchase funnel). The final result will look like this:
Requirements
You will need to create the following output tables:
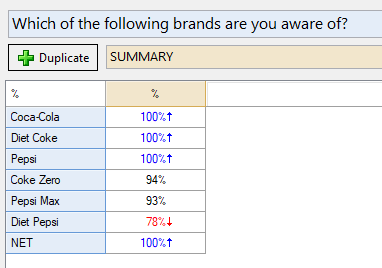
- Awareness
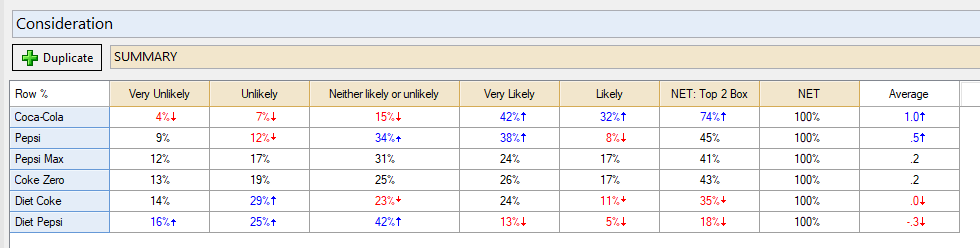
- Consideration (including Top 2 Box NET category)
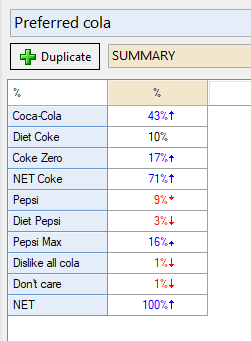
- Preferred brand/item
Method
Setting up your source tables
The easiest way to create the figures we need are with the usual tables in Q. We later reference certain cells within those tables and rearrange them in the final summary table. For the worked example, I created three tables upfront, shown below (and available in the QPack here):
Create an R Output
- From the toolbar, go to Create > R Output
- Paste the following into the R CODE expression box:
# Set the name of the brands
brands <- c("Coca-Cola","Diet Coke","Coke Zero","Pepsi","Diet Pepsi","Pepsi Max")

# Pull in the tables that will be used to create the brand funnel table
aware <- table.Awareness[brands]
consider <- table.Brand.consider[brands,"NET: Top 2 Box"]
main <- table.Preferred.cola[brands]

# Combine the tables into a single table and rename the rows
table <- cbind("Awareness" = aware, "Consider" = consider, "Preferred" = main)

# Set which output the funnel will use
funnel <- t(table)

# Create ratio calculation
ratio <- funnel["Consider",]/funnel["Preferred",]

# Add calculated output to the table and name the row
funnel <- rbind(funnel, "Ratio" = ratio)
In this example, I am using data that contains cola brands. You will need to update the brands on the first line of code to match your data. Lines 5-7 reference the tables that were created as part of the requirements.
NEXT
How to Create a Funnel or Pyramid Chart
How R Works Differently in Q Compared to Other Programs
How to Use Different Types of Data in R
How to Reference Different Items in Your Project in R
How to Work with Conditional R Formulas
How to Add a Custom R Output to your Report
How to Create a Custom R Variable