Introduction
This article describes how to use a summary grid table...
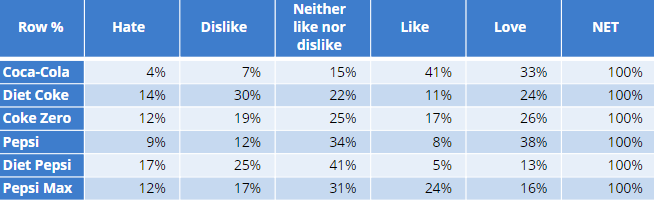
..to calculate an index score using the data from the table (e.g., an index score base on the following formula: Top 2 Box / (Top 2 Box + Bottom 2 Box) x 100):
Method 1 - using Column names
1. Select your table.
2. Copy the table name from Properties > GENERAL > Name.
3. Right click in the Report and select Add R Output.
4. Go to Properties > R CODE in the object inspector.
5. Add a line defining the table based on the name from step 2, e.g. brand_att = table_name
6. Now paste in the below code to set and calculate the index formula:
t2b = brand_att[,"Like"] + brand_att[,"Love"]
b2b = brand_att[,"Hate"] + brand_att[,"Dislike"]
numerator = t2b
denominator = t2b + b2b
index = (numerator / denominator) * 100
Note: the above code is based on the table shown above and is referring to column names "Like", "Love", "Hate", and "Dislike" which can be changed to match column names used in your table.
Method 2 - using the Column index
1. Select your table.
2. Copy the table name from Properties > GENERAL > Name.
3. Right click in the Report and select Add R Output.
4. Go to Properties > R CODE in the object inspector.
5. Add a line defining the table based on the name from step 2, e.g. brand_att = table_name
6. Now paste in the below code to set and calculate the index formula:
t2b = brand_att[,4] + brand_att[,5]
b2b = brand_att[,1] + brand_att[,2]
numerator = t2b
denominator = t2b + b2b
index = (numerator / denominator) * 100
Note: instead of column names the above code referred to column index. E.g., [,4] refers to the fourth data column in our table "Like".
See Also
How to Perform Mathematical Calculations Using R
How to Standardize or Calculate Data within Subgroups in R