The R language is a robust data analysis language, so when there is an error with the code, many times the error message returned is quite generic and technical. There are some error messages that do pop up fairly frequently though, and this article lists some of those and what types of issues they indicate. If you check Properties > OUTPUT > Show raw R Output your output will show each line of code ran and the error message beside the line of code that is causing the error. Then you can look into the errors below or see How to Troubleshoot R Code.
Incorrect number of dimensions / subscript out of bounds
Not equal to array extent / number of items to replace is not a multiple of replacement length
Missing / duplicated rows or columns
Requirements
Familiarity with How to Use R in Q and How to Work with Data in R.
Incorrect number of dimensions / subscript out of bounds
Example:

The below code will produce an incorrect number of dimensions error due to the last line:
#identify table
x = table.Gender
#return Female value
x["Female",]
If we add dim(x) to the code, we will see that it returns only a 3, that is 3 rows. There is not a second value because there is no additional column dimension. The solution therefore is to change the last line to x["Female"].
Not equal to array extent / number of items to replace is not a multiple of replacement length
Example:

The below code will produce a length of 'dimnames' [1] not equal to array extent error due to the last line:
#identify table
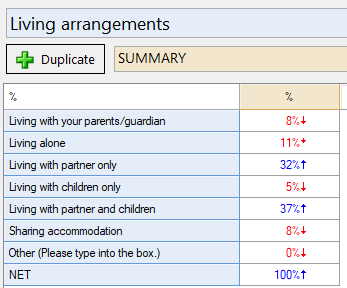
x = table.Living.arrangements
#new row names
newrows = c("Parents","Alone","Partner","Children","Partner + Children","Sharing","Other")
#rename rows
rownames(x) = newrows
If we add length(rownames(x)) and length(newrows) to the code, we will see that one returns 8 and the other 7. We can only replace the row names with the exact same number of items. The solution is to either add "NET" to the end of the newrows object or remove it from the source table via right-click > Hide.
Missing / duplicated rows or columns
Example:

The below code attempts to merge these two tables together but doesn't return the correct result:
#identify tables
x = table.Preferred.cola.2
y = table.Q4.Brand.Attitude.T2B
#combine tables
cbind(Preferred=x[rownames(y)],T2B=y)

If we add head(x) and head(y), we can view the figures as they should align. However, this doesn't solve the immediate problem. We can also compare the row names by using the below to see what labels don't match:
setdiff(rownames(x),rownames(y))
setdiff(rownames(y),rownames(x))

What we can see here is that the Pepsi label has a trailing space in one table which causes the merged table not to align properly. The solution is to right-click > Rename this label in the preference table and remove the space.
Next