Introduction
Many researchers like to suppress statistics that have small sample sizes. This often prevents clients from making false interpretations from the data. In this post, I explain how you can automatically modify the contents of tables made within R Outputs. In Q's basic tables, you can use a Rule to blank the cells: Modify Cell Content - Blank Cells with Small Sample Sizes.
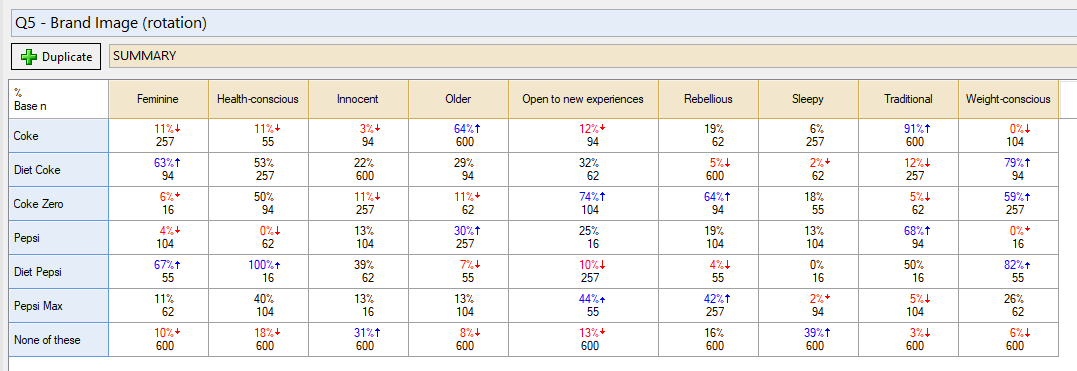
In my example I will take a table showing both % and Base n as statistics.:
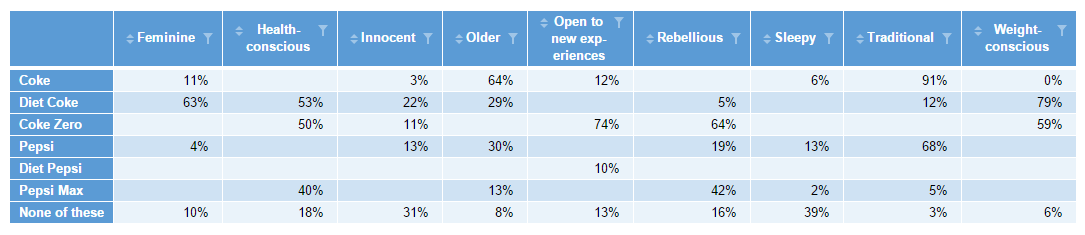
and change it to an R table with blanked cells with small Base n values:
Requirements
- A table showing both a statistic of interest and a sample size statistic (Base n, Column n, Base Population, etc) used for the blanking.
Method
1. Right click on your Report tree and select Add R Output.
2. In the object inspector on the right, paste in the following in the R CODE box and edit to your liking (you can find your table name for line 2 by right clicking on the table and selecting Reference Name):
#specify the table that you'd like to edit
x = table.Q5
#set the threshold for small sample sizes - cells with a size below this will be blanked
ss = 75
#create a copy of the table with just the % values
#you can change "%" to the statistic in your table that you want to show in the final version
values_tab = x[,,"%"]
#create a version of the table with just the sample size values
#you can change "Base n" to whatever sample size statistic is in your table
base_tab = x[,,"Base n"]
#find the cells in the sample size table that are below your threshold and set those same
#cells to be blank (NA) in the table with your final values
values_tab[base_tab < ss] = NA
#return the final version of your values table
values_tab
3. Click on Calculate to run the code and see your final table (shown above).
Adapting the code – having a separate table of values and base size
If you’re borrowing the above code, be sure that you’ve got the correct statistics in the source table. For example, the base n in a cross-tab is different from the column n. The column n is what is used to derive column-%’s. Remember, in multi-variable questions (such as a Pick Any), the base n or column n could vary by row (or column). In the worked example above, each cell in the source table was a separate binary variable (grouped into a Pick Any – Grid), so had its own base n.
You don’t have to use just one source table either. You could have the statistics in separate source tables, but you’d need to adjust the code accordingly, a bit like the below (where lines 1 and 2 refer to different tables).
#specify the table that you'd like to edit for the final result
values = table.Q5
#specify the table with sample size that you'd like to use to blank the other values
base = table.Q5.base
#set the threshold for small sample sizes - cells with a size below this will be blanked
ss = 75
#find the cells in the sample size table that are below your threshold and set those same
#cells to be blank (NA) in the table with your final values
values[base < ss] = NA
#return the final version of your values table
values_tab
Of course, you can fiddle with the code to produce a different outcome. For instance, you can set all the cells to 0 instead of NA if you prefer.
Next