Introduction
This article describes how to extract the column comparison letters from a table using R when the table has multiple statistics. For instance, you may want to place these in a table in PowerPoint adjacent to a chart of the data. The column comparison letters are only available in the source table if you also have another statistic involved in the table. You can apply the same approach to extract any statistic from a source table with multiple statistics.
Requirements
Basic familiarity with R code in Q: How to Use R in Q
Method
Reference a third dimension in the source table that has multiple statistics
The logic to extract just the value of a cell using R is something like this:
table[row,columns]
That works fine with one statistic in the source table. When the source table has multiple statistics per cell, these form a “third dimension” in the table. So the referencing then becomes:
table[rows,columns,statistic]
When there’s only one statistic in the source table, you don’t need to specify the third dimension (R assumes it’s 1). But when there are multiple statistics involved, each cell becomes an array of statistics. This means, you need to tell R which number from the array you are referencing. If you get the red error message in Q – “incorrect number of dimensions” – one possible reason is that you’ve got a source table with multiple statistics per cell. R needs you to be specific as to which statistic you want to retrieve from those available.
Consider the source table below which is a crosstab. Suppose it has a reference name of table.Q4.Brand.Attitude.
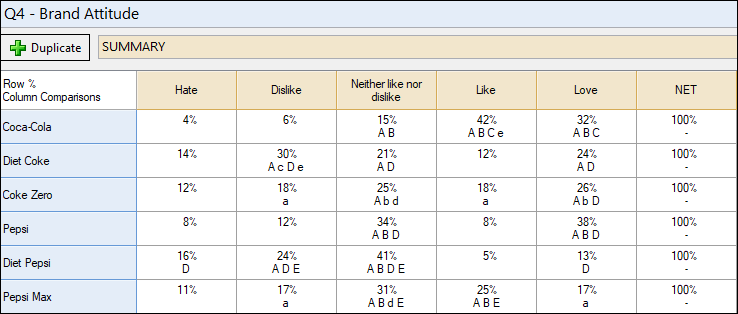
If we wanted to extract only the column comparison letters into a secondary table, all we need to do is specify we want the second statistic:
table = table.Q4.Brand.Attitude
ColumnComparisons = table[,,2]
The results are as follows:
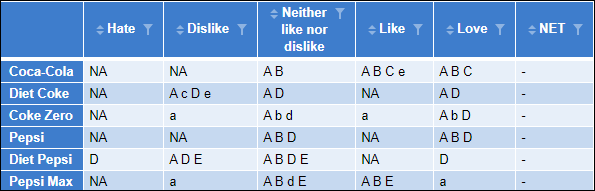
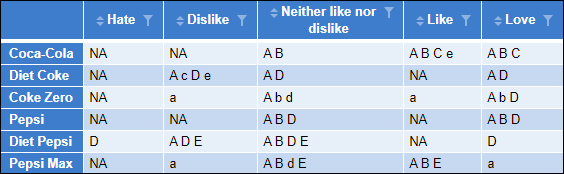
Now if you didn’t want the NET column, you could either remove or hide it from the source table. Alternatively, or you could remove them from the R Output, with this quick adjustment:
table = table.Q4.Brand.Attitude
ColumnComparisons = table[,,2]

NoNet = table[,-6,2]
The minus 6 removes the 6th column the new table. There are ways to remove these rows based on row name as well, but that's more advanced R code.
Next