This article provides a checklist for troubleshooting R code used in R Outputs, Variables, and Data Sets. A list of Helpful functions used to Troubleshoot is at the end of the document for quick reference. There is also a video and Displayr document example on troubleshooting code in the Using R in Displayr Video Series. If you are troubleshooting R code that you created outside of Q, please see How R Works Differently in Q Compared to Other Programs before using the troubleshooting guide below.
1. Gather the details about the issue
2. Find what is causing the issue
3. Figure out a workaround or a solution
Helpful Functions used to Troubleshoot
Requirements
- An R variable, R output, or data set.
- Familiarity with the different Structures and Value Attributes for questions will help you understand how to structure your data so that it comes in appropriately to R.
- Familiarity with the tips on writing R code in How to Use R in Q, which outline some common troubleshooting tactics while creating custom R code.
- It's also useful to know How to Work with Data in R and How to Use Different Types of Data in R.
Method
1. Gather the details about the issue
You will use these details and information to help in the troubleshooting steps below.
-
- What is the expected outcome and what's happening instead?
- If it's not already in an existing R-based output or custom R Output in the Report, copy the R code into a Report > right click > Add R Output in the Properties > R CODE box in the object inspector on the right.
- Read through comments in the code (in green) to get a general sense of what each section of code is supposed to do.
- Click on the OUTPUT > Show raw R output box and review any warnings (in orange) or error messages (in red) that pop up and confirm which line of the code the error is being triggered (you may also want to change Include R code to see the code alongside the output itself like below). You'll see from the snapshot below, the error is occurring after the 6th line of the code.
- Check any error messages against Common Error Messages in R Code.
- If the error is not due to a particular function, see How to Work with Data in R for a reference on the correct syntax to use when working with data.
- Search the Q Help center for the function name or use case (sorting a table "using R") to see if there are other examples of code where it is used without error.
- If the error occurs after a particular function, google the function name with the suffix "in R" to find documentation on what that function does and what types of inputs it requires. You can also hover over the function in the code to get a quick preview.
2. Find what is causing the issue
- Is the Automatic checkbox checked so that the output is updated automatically? It could be an outdated result. Try clicking Calculate again to make sure the most up-to-date data is being used.

- Keep in mind that function and data names are case-sensitive in R. If the data name is not Highlighted in the code, it's likely it's not referenced correctly and R can't find the data.
- Confirm the tables/variables/values are being used in the code.
- You can right-click on an R output or variable and click Trace dependencies menu to quickly see what items are being used by the R code.
- You can hover over a Highlighted reference to get a preview of the data being sent to R. For example, the code below is not working because R is receiving the code labels from the Age variable and not the underlying code values:
- If creating an R variable, the values used by R are shown in grey alongside the final result (in blue) after clicking play to run the code:
- For any variables created in the R code in an R output, you can simply put the variable name on a new line in the code or use print() (if the data is within a function or for-loop) to see the data in the raw R output:
- Check the syntax of the current code to make sure it matches other example codes found.
- Review the code and use comments to keep track of what each line of code should be doing so you know what to expect when testing to find the source of the problem.
- If there's an error message, review the internal documentation or any googled results you found about the error message to get clues as to what may be the problem and what might be the solution.
- If the error message is with a specific function:
- Confirm the function is actually supposed to do what you expect it to do based on the documentation.
- Confirm the data and other inputs used by the function are what you expect it to use. Print the data and other inputs to the raw R output or use one of the Helpful Functions used to Troubleshoot below to check to make sure the data is structured as expected.
- Confirm the arguments (settings) used in the function are all in the documentation of the function and that the values given to them are what they expect. For example, are you giving a list of row names to an argument that expects TRUE/FALSE?
- If you've modified code from an article in our Help Center, check that all the appropriate steps and requirements in that article were followed.
- Identify what is causing the error or what line the data starts to give unexpected results:
- Start from the line with the error or unexpected result and print the data and other inputs to the raw R output or use one of the Helpful Functions used to Troubleshoot below to check to make sure the data is structured as expected.
For example, below it becomes more apparent that the cause of the error is that there are 6 rows in table x but we're only providing 4 values when we try to change the second column. - Rinse and repeat the previous step as needed moving up the lines of code confirming variables/data used are what you expect until you reach the earliest line where the result is wrong/unexpected. This is the line where you should start testing to find a solution.
- Start from the line with the error or unexpected result and print the data and other inputs to the raw R output or use one of the Helpful Functions used to Troubleshoot below to check to make sure the data is structured as expected.
3. Figure out a workaround or a solution
If the steps above don't lead to an obvious solution, use what you've learned to work toward a solution beginning with the first line that creates the issue. Note, you may need to revisit 2. Find what is causing the issue if your solution to one issue uncovers or causes another.
- Is the thing that caused the issue required or can you work without it?
- Are there things with the syntax you can tweak to see if there's an undiagnosed syntax issue? Most commonly this would deal with adding/moving commas, "", (), {}, and [].
- Is there a different way of referencing the data you're trying to create? See How to Work with Data in R for how to reference based on position or name given the data's structure and other tips.
- Is there a different function you can use to get the data you expect? For example, you can sort a table of data using sort() or order(). Search in our Help Center or google for more ideas.
- Can you get something close but adequate to what you ultimately need with a different process that doesn't require R? For example, hiding rows with small sample sizes using a Rule rather than within R.
4. Contact Support
If you've worked through these steps and haven't figured out the issue or solution, please contact our support team at support@q-researchsoftware.com or by clicking on File > Share > Send to Q Support (Encrypted) from within your specific Q project. While we cannot create or troubleshoot complex, custom R code for users through support, we can try to help you at least identify the issue and point you to relevant resources that may help you get unstuck.
Helpful functions used to Troubleshoot
There are a number of functions which can be used to help work out where an issue in your code exists.
In this example I have defined my table as x in my code and have ticked Show raw R output:
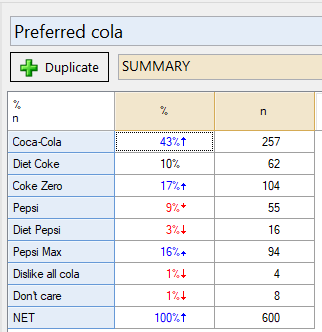
x = table.Preferred.cola
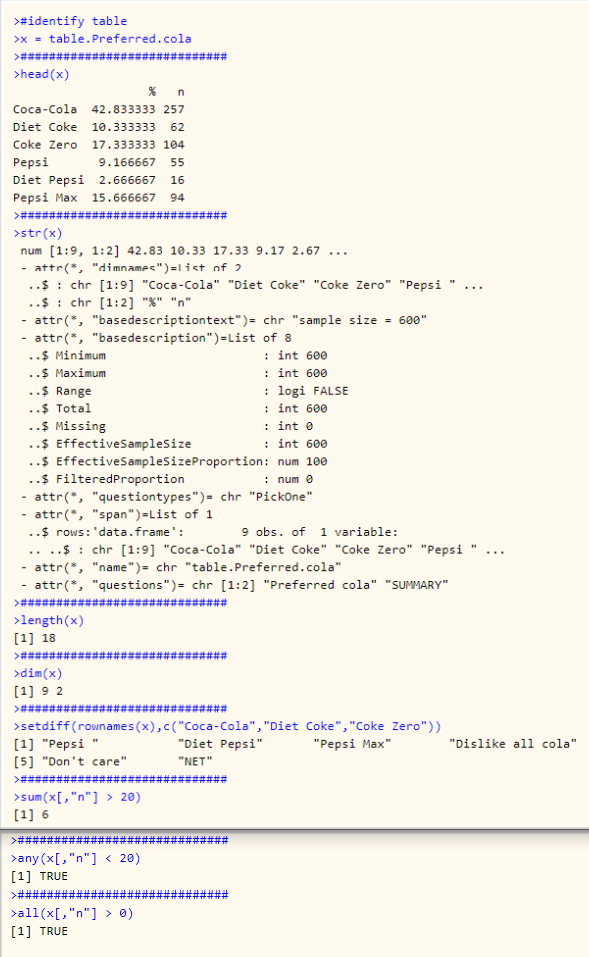
- head() - a quick way to inspect your table/variable in your code to make sure it's set up as you expect.
head(x)will display the top 6 rows by default andhead(x,10)will display the top 10. - str() - describes the data and structure of the variable/calculation.
str(x)will return the structure of your data, including names, statistics, and data types. - class() - tells you what R class property your table/variable belongs to.
class(x)in this example will display matrix and array. - length() or dim() - tells you the size of your variable.
length(x)in this case, will return 18 (the total number of table cells) anddim(x)will return 9 and 2 to represent the number of rows and columns respectively. - setdiff() - shows you items in one list that are not in the other.
setdiff(rownames(x),c("Coca-Cola","Diet Coke","Coke Zero"))will compare the table row labels to these three Coke brands and return only the Pepsi and 'unengaged' categories. - sum(condition) - see how many times a condition holds true using sum to make sure your condition/logical test is set up correctly.
sum(x[,"n"] > 20)will return a true if the sum of the n column is over 20. - any(condition) or all(condition) - check to see if any or all of the items you're testing come back true.
any(x[,"n"] < 20)will tell you if any of your n rows are less than 20, andall(x[,"n"] > 0)will tell you if all your n rows are greater than 0.
The functions above result in the following the raw R output when added to code:
Next
How to Extract Information from an R Object