Introduction
This article describes how to create dynamic text using a custom R Output that updates and changes color based on your data. This is especially useful when automating a tracking report. You can download a copy of this example (and more) in a QPack through this link.
For example, it's possible to create call outs that are color coded and customized based on current data. You can use these in your PowerPoint presentations to enhance your report (as seen below)...
...that will automatically update when the data changes.
Requirements
- A data set imported into Q.
- Basic familiarity with HTML and CSS.
- Understanding of How to Work with Data in R and How to Work with Conditional R Formulas.
Method - Updating the Entire Text or Number
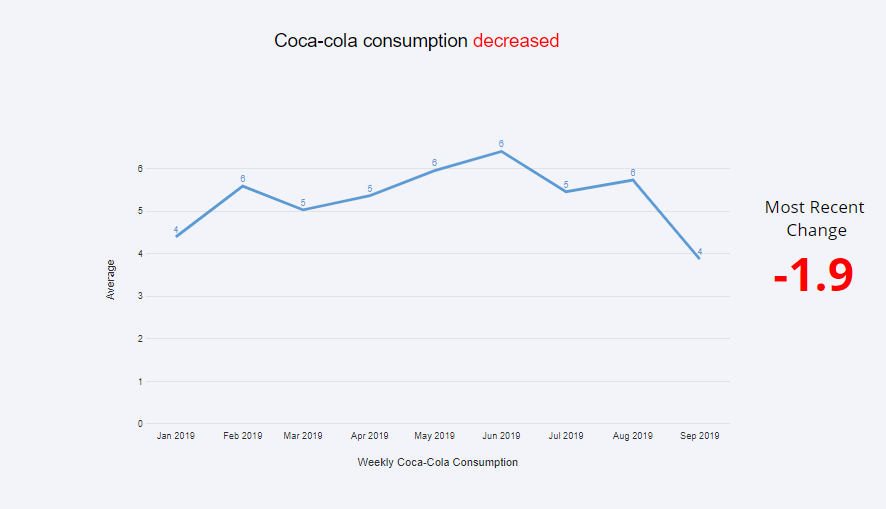
In the example below, I'm creating a custom R Output to find the most recent difference in data in the table feeding my chart and highlight it in an appropriate color, like:

To modify for your own document, please read through the comments (denoted with #) and edit where appropriate.
- Right click in your Report tree and click Add R Output.
- Paste in the following R code in the R CODE box in the object inspector:
###Create your custom calculation here
#identify the table with the data
x = table.Weekly.Coca.Cola.Consumption.by.Date.Mth
#subtract last month/column by previous month/colomn to get the most recent change
diff = x[NCOL(x)]-x[NCOL(x)-1]

###Create the default formatting of your text
#make color of font default to black if zero
textcolor = "black"

###Change the font color based on the calculation
#if a decrease make color red else use the current color of textcolor (black)
textcolor = ifelse(diff < 0, "red", textcolor)
#if an increase make color blue else use the current color of textcolor (black or red)
textcolor = ifelse(diff > 0, "blue", textcolor)
#round the calculation to 1 decimal
diff = round(diff,1)

###Create the HTML code inserting the text and font color
#create html with specific coloring
your.html = paste('<DOCTYPE html>
   <html>
     <head><style>
           div.mystyle {font-size: 50px;
           font-family: Open Sans;
           font-weight: bold;
           text-align: center;
           color: ', textcolor,';}
     </style></head>
     <body>
        <div class = "mystyle">',
            diff,
        '</div>
     </body>
   </html>', sep="")

###Tell Displayr we want to render the HTML code
#rhtmlMetro::Box processes the HTML
rhtmlMetro::Box(text = your.html, text.as.html = TRUE)
Method - Updating Part of the Text
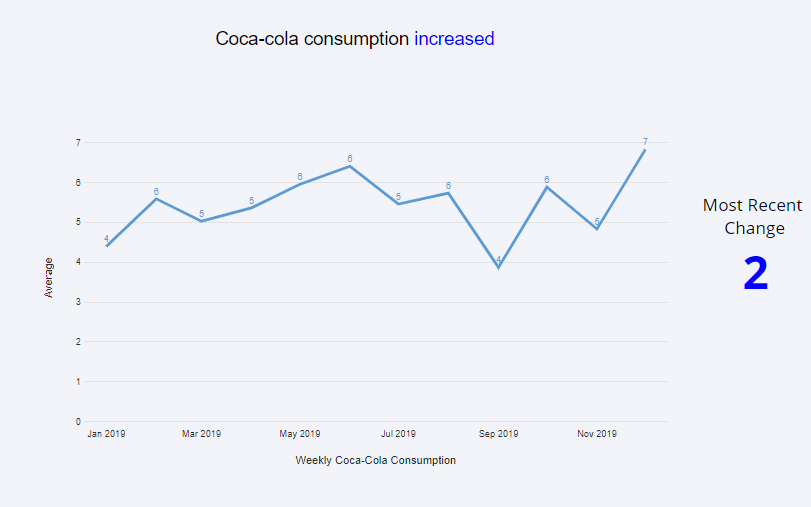
In the example below, I'm creating a custom R Output to add commentary about recent changes in the data and highlight the specific change in an appropriate color, like:

To modify for your own document, please read through the comments (denoted with #) and edit where appropriate.
- Right click in your Report tree and click Add R Output.
- Paste in the following R code in the R CODE box in the object inspector:
###Create your custom calculation here
#identify the table with the data
x = table.Weekly.Coca.Cola.Consumption.by.Date.Mth
#subtract last month/column by previous month/column to get the most recent change
diff = x[NCOL(x)]-x[NCOL(x)-1]

###Create the default formatting of your text
#Set the defaults for the text and font color
textcolor = "black"
difftext="remained the same"

###Change the text and the font color based on the calculation
#if there is a decrease
if(diff < 0){
    textcolor = "red"
    difftext = "decreased"
} else if(diff > 0) { #if there is an increase
    textcolor = "blue"
    difftext = "increased"
}

###Create the HTML code inserting the text and font color
#paste will insert the values for textcolor and difftext from above into the HTML code
#the colordiff CSS tag is also created to only modify a portion of the text
your.html = paste('<DOCTYPE html>
    <html>
        <head><style>
                div {font-size: 20px;
                    text-align: center;}
                colordiff {color: ', textcolor,';}
        </style></head>
        <body>
            <div>
            Coca-cola consumption <colordiff>',
                difftext,
            '</colordiff></div>
        </body>
    </html>', sep="")

###Tell Displayr we want to render the HTML code
#rhtmlMetro::Box() processes the HTML
rhtmlMetro::Box(text = your.html, text.as.html = TRUE)
See Also
How to How to Export Updatable Text to PowerPoint from Q
How to Use Paste Functions to Create Automatic Text Using R
How to Relabel Rows and Columns in an R Table
How to Create a Dynamic Text Box
How to Work with Conditional R Formulas
How to Customize a Table using CreateCustomTable in R