Introduction
This article describes how to access your data using R code and use it in calculations or other manipulations.
Requirements
- A data set loaded into Q.
- An R Output or R variable.
- Knowledge of How to Use Different Types of Data in R.
Method - Accessing your data
There are several ways to access your data within R code.
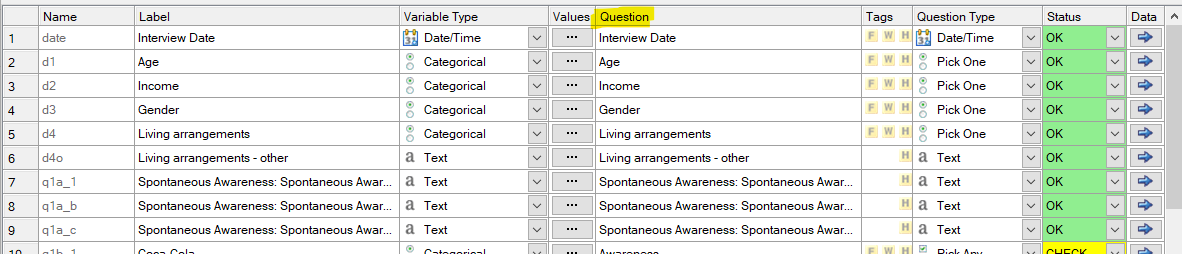
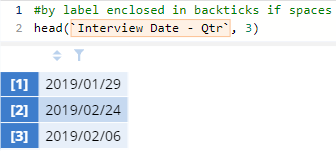
- By the Question Label inside backticks:
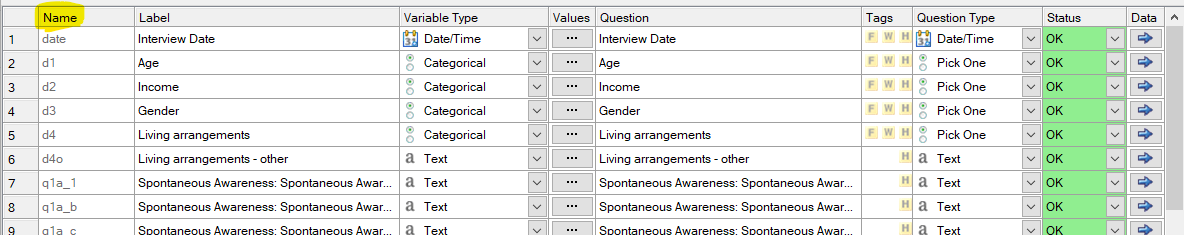
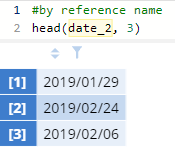
- By the Name of the variable:
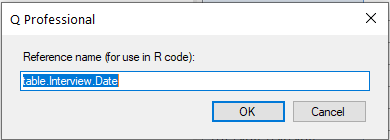
- By the Reference name of the table or output in your Report. This is found by right clicking on the item and selecting Reference name:
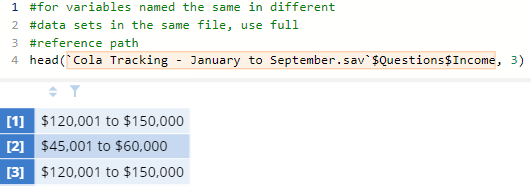
You can also reference variables in specific data sets by adding a prefix for the filename and Questions:
Method - Working with different data structures
You can reference a particular bit of your data structure using square brackets [] and the appropriate index.
1. Vector
A vector is a series of data points that can be anyone data type (character, numeric, etc), but not be a mix of types (otherwise they will convert everything to character). When you reference a single variable in your data set using R, it will be in the form of a vector. One-column tables are also interpreted by R as vectors.
Vectors can also be created manually using the c() function:
numbers = c(2,5,10)
strings = c("hello", "good day", "good bye")

Detailed example:
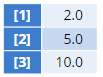
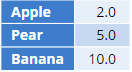
In the below example, we have a table called fruit:
Referencing:
- The syntax for indexing is:
fruit[Item]. - To return the value for Pear, we can use the row number
fruit[2]or the row labelfruit["Pear"]. - To fill in missing data for values under 5, we can use a condition inside brackets
fruit[fruit
  < 5] = NA
.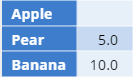
Other Useful Functions:
- To return the row labels, we use
names(fruit). - To return the number of rows, we use
length(fruit)orNROW(fruit).
2. Matrix
A matrix is a table with rows and columns where data is the same data type. In Q, built-in tables showing a single statistic, variable sets, and those created by cbind in R will be interpreted as matrices.
This can be created manually using the matrix() function:
tab = matrix(c(c(1,2,3), c("a","b","c")), ncol=2, nrow=3)
Detailed example:
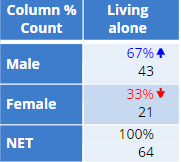
In the below example, we have a crosstab table called living.alone:

Referencing:
- The syntax for indexing is:
living.alone[Row]for a single column SUMMARY table.living.alone[Row , Column]for any other table.
- To return the value for Male, we can use
living.alone[1,]orliving.alone["Male",]. - If there is only one column, use
living.alone[Row , Column , drop = F]to keep the original table dimensions. Otherwise, the result will be interpreted as a vector.
Other Useful Functions:
- To return the row labels, we use
rownames(living.alone). - To return the column labels, we use
colnames(living.alone). - To return the table's dimensions we use
dim(living.alone). This will return 3 (rows) and 1 (column). - To return the number of rows, we use
NROW(living.alone). - To return the number of columns, we use
NCOL(living.alone).
3. Array
An array is a multi-layered table where data is the same data type. In Q this is a crosstab with multiple statistics.
This can be created manually using the array() function:
tab = array(c(1,2,3), dim=c(3,4,2))
Detailed example:
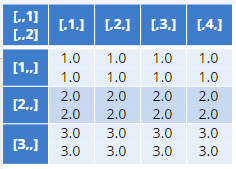
In the below example, we have a table called living.alone with two statistics:
Referencing
- The syntax for indexing is:
living.alone[Row , Column , Statistic]. - To return the Count value for Male, we can use
living.alone[1,,2]orliving.alone["Male",,"Count"]. - If there is only one column, use
living.alone[Row, Column, Statistic, drop = F]to keep the original table dimensions.
Other Useful Functions:
- To return the table's dimensions we use
dim(living.alone). This will return 3 (rows), 1 (column) and 2 (statistics). - To return the row labels, we use
rownames(living.alone)ordimnames(living.alone)[[1]]. - To return the column labels, we use
colnames(living.alone)ordimnames(living.alone)[[2]]. - To return the statistic labels, we use
dimnames(living.alone)[[3]]. - To return the number of rows, we use
NROW(living.alone). - To return the number of columns, we use
NCOL(living.alone).
4. Data.frame
A data.frame is a table with rows and columns, like a matrix, but can be a mix of different types of data.
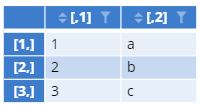
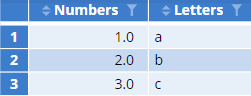
This can be created manually using the data.frame() function:
mydf = data.frame(Numbers=c(1,2,3), Letters=c("a","b","c"))
Detailed example:
Referencing and other useful functions are the same as used when working with a matrix, with some additional functionality below.
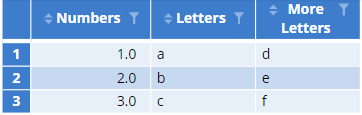
You can additionally reference an entire column using $. For example, mydf$Letters would return only the Letters column.
You can also add new columns on the fly with $:
mydf$`More Letters`=c("d","e","f")
mydf
Get a copy of the examples above in your account by clicking HERE.
See Also
How R Works Differently in Q Compared to Other Programs
How to Use Different Types of Data in R
How to Reference Different Items in Your Project in R
How to Work with Conditional R Formulas
How to Add a Custom R Output to your Report
How to Create a Custom R Variable