Introduction
This article describes how R functions can be used to create chart templates, which keep the look and feel of reports consistent.
Chart templates are useful for quickly creating standard-looking charts with your preferred settings (eg, font sizes, colors, etc.). When you start using R, you do this by saving the code you use to create a chart and then re-using it with small modifications. While this can save some time, it tends to lead to inconsistencies, as when you modify one chart, you forget to modify the code everywhere that you use the same chart. Writing an R function can save you from having to reuse the entire code.
An advantage of doing this is that when you modify the function, all the charts using the function update automatically without you needing to rerun the code. This is because Q works out all the dependencies between calculations and keeps them up-to-date.
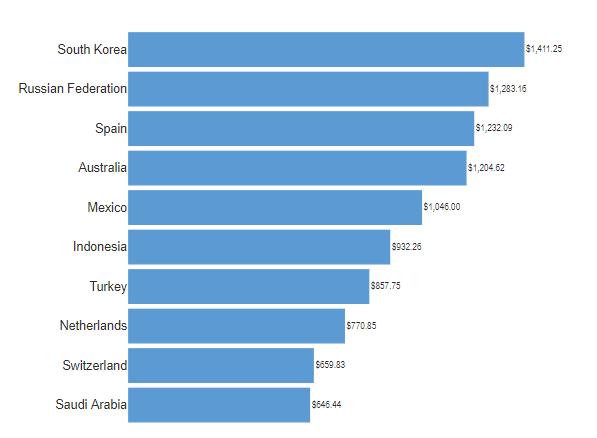
In this example, I will explain how to create a template to reproduce the chart shown below, which is showing GDP by country. This chart was created with the Displayr/flipStandardCharts package on GitHub, but the principles can be applied to almost any charting package in R.
Requirements
- Displayr/flipStandardCharts package (for this specific example) or any other special visualization packages like ggplot2 or ggplotly
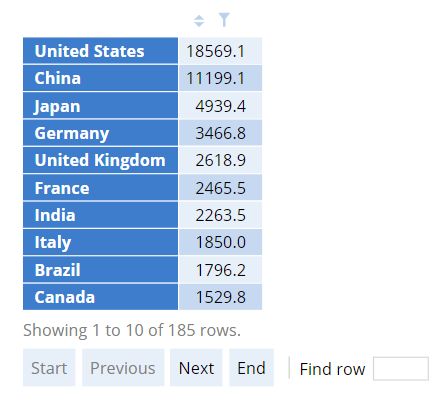
- A table which will be used to create the visualization - either created in a built-in table or R Output.
In this example, I have created a table using an R Output:
Method
- Right click on the Report tree and select Add R Output.
- Paste the following into the R CODE area in the object inspector on the right:
MyBarChartTemplate = function(x)

{
    require(flipStandardCharts)
    Chart(x,
        data.label.show = TRUE,
        data.label.font.size = 8,
        data.label.font.family = "Arial Narrow",
        data.label.decimals = 0,
        type = "Bar",
        y.grid.width = 0,
        x.tick.show = FALSE,
        x.grid.width = 0,
        x.bounds.minimum = 0,
        x.bounds.maximum = 20000)
}

MyBarChartTemplate(gdp[1:10])
-
-
- The first line of code says we are creating a function in R called MyBarChartTemplate.
- The x on the first line tells us that when we use this function, whatever data we use will be used in place of x when the code below it is run. In this case, it means that the data will be plotted using the Chart function from flipStandardCharts.
- require(flipStandardCharts) means that we will load the flipStandardCharts package whenever we run the function (if it is not already loaded).
- The very last line says to use the function to create a chart of the first 10 numbers in gdp, which is the name of the table that I created in the Requirements section.
-
2. To add more parameters to the function, you can update the R CODE to the following:
MyBarChartTemplate = function(x, decimals = 2)

{
    require(flipStandardCharts)
    Chart(x,
        data.label.show = TRUE,
        data.label.font.size = 8,
        data.label.font.family = "Arial Narrow",
        data.label.prefix = "$",
        data.label.decimals = decimals,
        type = "Bar",
        y.grid.width = 0,
        x.tick.show = FALSE,
        x.grid.width = 0,
        x.bounds.minimum = 0,
        x.bounds.maximum = 2000)
}

MyBarChartTemplate(gdp[11:20])
In the example above, I have added a parameter called decimals and given it a value of 2 to the first line. I also modified line 9 so that the value of decimals is passed to data.label.decimals. You can customize the width of X-Axis in the chart by updating the number in x.bounds.maximum. I've also added a $ to data.label.prefix to add a $ to the front of the data labels, and updated the rows to show in the last line of code to rows [11:20].
3. Once you have created functions you find useful, you can create a file(s) where you store the functions. You can insert an R Output for this by right clicking in the Report tree and select Add R Output and paste the final code into the R CODE area. You will call in the function into any new visualizations or calculations by using the R Output name under GENERAL > Name. In this example, you would use MyBarChartTemplate. You can hide the calculation output by right-clicking it and selecting Hide.
You can also paste the saved functions into any of your R Outputs as soon as you start working on anything.
An advanced next step is to automate this process by creating your own package. For example, flipStandardCharts, which was used to create the charts in this post, is itself a package that my colleagues created to make it easier for us to quickly create charts using plotly.
See Also
How to Share Custom R Functions