Introduction
This article describes how to add a custom code R Output to your project. These outputs use custom R code to create virtually anything, and is typically used to show a reformatted table, specialized chart, data set, dynamic text, or stylized number. An R Output can also be referred to by other R Outputs and R Variables.
Requirements
A Q project.
Method
1. Right click on the Report tree where you'd like to insert your R Output and select Add R Output.
2. Enter your R code in the object inspector under Properties > R CODE.
3. Click the Calculate button if code is not automatically ran.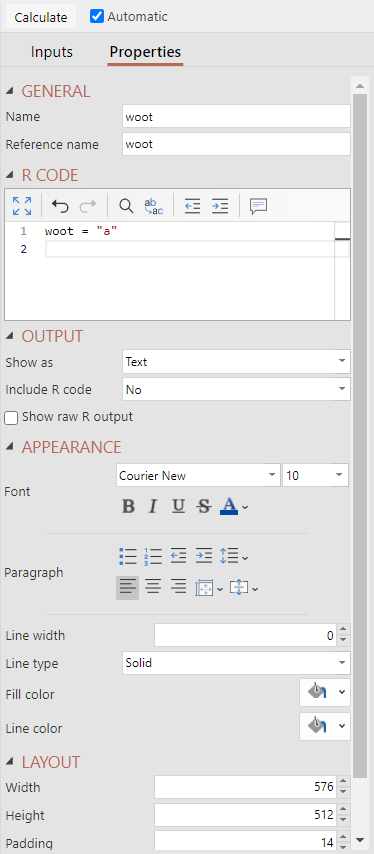
4. OPTIONAL customizations:
- If you don't wish for your Calculation to automatically re-calculate when the data updates, uncheck Automatic.
- Revise the name of the output under GENERAL > Name in the object inspector on the right. This will be the name that is shown in the Report tree and may include spaces and other special characters.
- Revise the Reference name. This will be used to reference this output in other R outputs and variables. It must not contain spaces and usually is updated based on the final variable name returned by the output.
- You can adjust the display options under OUTPUT:
- Show as lets you choose between text and table (when appropriate).
- Include R code lets you display the R code with the result.
- Show raw R output prints the R terminal displayr from running your code. This will show additional R messages and logs in line with the code that generates them. This is very useful when troubleshooting code, and can be used for returning the results of intermediate objects.
- You can adjust the appearance of the output under APPEARANCE such as Font and Colors.
- You can adjust the size of the output under the LAYOUT section.
- From the toolbar at the top, you can adjust the decimal places and number format with the same icons as you'd use for built-in tables.
Notes
When outputting respondent-level data that matches the number of records in your data set, you can additionally apply a filter via Inputs > FILTERS & WEIGHT > Filter(s). Note, this will only work if you use QFilter in your R code to filter your rows. Otherwise you will get the following warning:![]()
If you reference other tables that are already aggregated (such as SUMMARY or crosstabs) or a Standard R output such as a visualization or analysis, applying a filter to the R Output will not work because it only uses the final numbers from the table/visualization and does not access the raw data. You will instead need to apply them to your source tables so your data can be filtered before aggregation.
Next
How to Perform Mathematical Calculations Using R
How to Work with Conditional R Formulas
How to Extract Information from an R Object
How to use the Filter(s) Dropdown to Quickly Filter R Outputs using QFilter