Introduction
Each built-in Q table stores attribute parameters which can be called via R using the attributes() function, such as the base, filters, spans, and statistics shown. When using these tables in R, sometimes you may want to modify some of these parameters or extract some of the information for a completely different type of output in R. This can be useful when you want to rename a column of a SUMMARY table in an output that is reformatted or if you want to create your own statistic based on a custom calculation.
For example this table:

Has attributes including the following (and more):

Requirements
- A table. These examples will use the table above named table.Preferred.cola.
- An R output.
Method - Extracting Information
In this example, we will extract the filter name applied to the table.
1. In the R Output, paste the below under Properties > R CODE:
mytable=table.Preferred.cola
attributes(mytable)

filter = attr(mytable,"filter.labels")

paste0("Filters used in this section: ",filter)

Method - Changing the Statistic
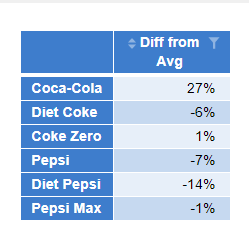
1. In the R Output, paste the below under Properties > R CODE which will center the percentages around the average:
mytable=table.Preferred.cola2. Click Calculate to see the table:
mytable = mytable - Average(mytable)

4. We want to change the statistic name shown in the first column to be something more descriptive. We can use the attr() function on the left side of the = sign to change this attribute for the table and call the final table result using:
attr(mytable,"statistic") = "Diff from Avg"
mytable
5. Press the % symbol in the toolbar to add percentages to the numbers on the table and the table will display as expected.
Next
How to Work with Nested Banners and Spans in R Tables
How to Extract Data from a Multiple Column Table with Nested Data
How to Combine Tables with Multiple Statistics Using R
How to Extract Information from an R Object