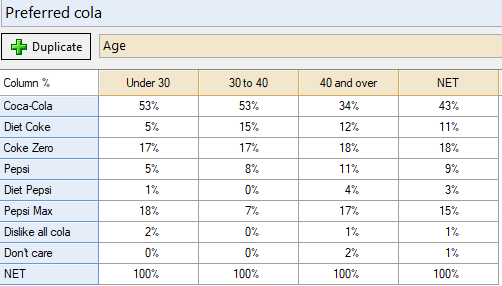
This article describes how to go from a standard table in Displayr showing no significant differences:
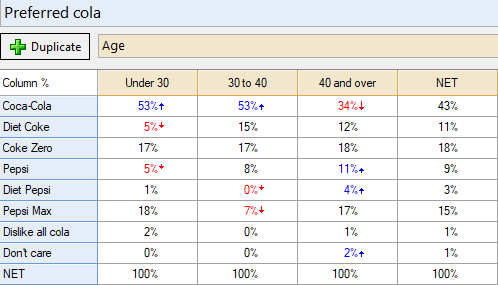
To a table that shows cell comparison significant differences:
Method
To perform significance testing in Q:
- From the toolbar, from the Show Significance menu, select one of the following options:

You can select Arrows and Font Colors, or you can select Arrows OR Font colors individually if you instead prefer to show one or the other. These will conduct exception tests, also called complement tests, where the value in a cell is tested against the value of respondents not in that column, or its exception. You can also select Compare columns to perform column comparisons, also called pairwise testing.
Using the New Statistical Assumptions dialog:
Beginning in Q15.14.1.0, a new Statistical Assumptions dialog has been added that is designed to give you complete control over statistical testing.
- Right-click the table and select Table Options > Statistics Assumptions. If you want to change the statistical assumptions for your entire project, from the toolbar, select Edit > Project Options > Customize > Statistical Assumptions
You will see the Statistical Assumptions dialog: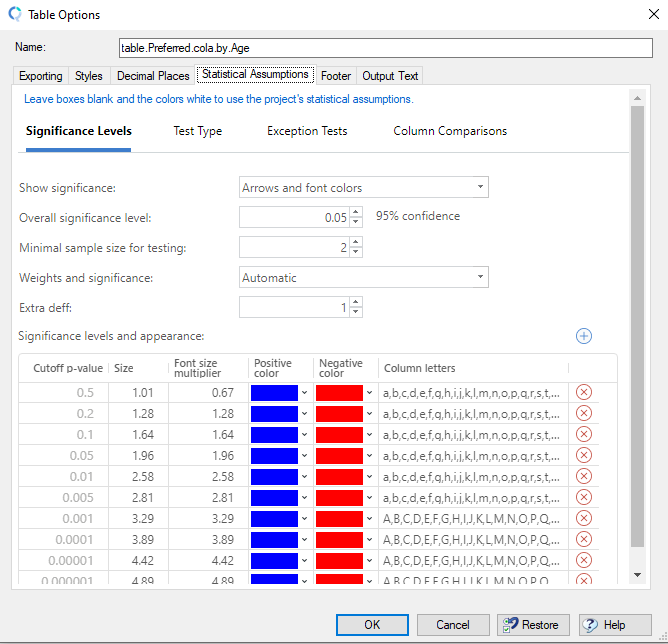
- Select from one of the four tabs on the top depending on the type of task you want to perform:
- Significance Levels:
- Show significance: show higher or lower significance with arrows, font colors (tables only), or using symbols to show significant differences between columns
- Overall significance level: is used when determining which results to show as being statistically significant
- Minimal sample size for testing: where cells have sample sizes of less no significance test is conducted when conducting automated tests of statistical significance between cells (i.e., Cell Comparisons and Column Comparisons).
- Extra deff: by default, the deff value (design effect) is set to 1.00
- Significance levels and appearance: symbols used to denote different levels of statistical significance.
- Test Type:
- Proportions: non-parametric tests will be done on categorical data
- Means: t-test will be done on numeric data and corrected with Bessel’s correction
- Correlations: default is Pearson
- Equal variance in tests when sample size is less than: if the sample size is less than 10 variance is assumed equal.
- Exceptions Test:
- Multiple comparison correction: False Discovery Rate is by default applied to help reduce the number of false positives based on the entire table. A check box is available if instead, you prefer to apply the correction within each span within each row.
- Column Comparisons:
- Multiple Comparison correction: the following corrections are available for post hoc testing: Fisher LSD, Duncan, Newman Keuls (S-N-K), Tukey HSD, False Discovery Rate (FDR), False Discovery Rate (pooled t-test), Bonferroni, Bonferroni (pooled t-test), Dunnett.
- Overlaps: The default is to ignore the sample that overlaps between columns when respondents in columns are not mutually exclusive
- No test symbol: - is shown if a test isn’t performed due to settings
- Symbol for non-significant test: nothing is shown if a test comes back insignificant
- ANOVA-Type Test: Select whether ANOVA-type tests are run as part of the testing
- Show redundant tests: Select whether to show significance on one cell (the one with the higher value) or all cells involved in testing.
- Show as groups: Show letters for insignificant columns rather than significant
- Recycle column letters: Each span begins labeling columns at A
- Significance Levels:
Restore all of the fields to their default values
- Click the Restore button

Technical Notes
More detailed information on the settings above can be found on our wiki on the Statistical Assumptions page.
Next
How to Modify Significance Tests
How To Override Default Statistical Testing Settings