Introduction
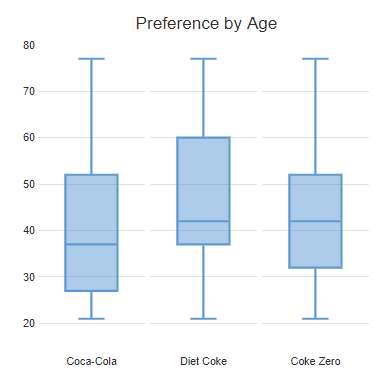
This article describes how to create a grouped box plot. You will end up with a plot like this:
Requirements
- A Number variable with data to plot.
- A categorical variable (Pick One) to use for groupings.
Method
- Go to Create > Charts > Visualization > Distributions > Box.
- Under Inputs > DATA SOURCE > Variables select your Numeric variable which has the data you want to plot.
- Under Inputs > DATA SOURCE > Groups select the categorical variable to group by.
Note: the Groups box will not appear until variables have been selected in the Variables box. - Click Calculate and/or ensure Automatic is checked.