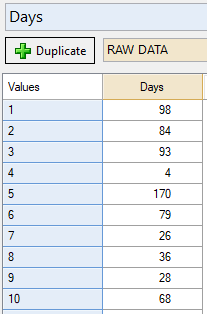
This post will take you from a variable that shows numeric values, such as the number of days to trial a product:
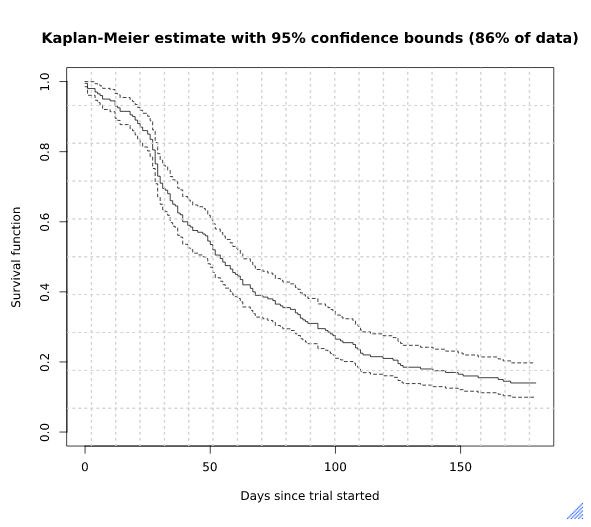
To a state where you can visualize the probability of an event at a certain time interval, such as the proportion of people who have yet to purchase at each point in time. Survival curves are also known as Kaplan-Meier curves:
Requirements
- A numeric variable.
Method
- Go to Create > R Output.
- In the object inspector, go to Properties > R CODE and paste in the following code and click Calculate.
library(survival)
surv.days = Surv(Days)
surv.fit = survfit(surv.days~1)
#Set Plot title
plot(surv.fit, main = "Kaplan-Meier estimate with 95% confidence bounds (86% of data)",
#Set x-axis title
xlab = "Days since trial started",
#Set x-axis maximum and minimum limits
xlim = c(0, 180),
# Set y-axis title
ylab = "Survival function")
grid(20, 10, lwd = 2)
In the code above, "surv.days = Surv(Days)", Days is the name of your numeric variable being used to create the density plot. This must be updated with the variable's Name in your data set.