Introduction
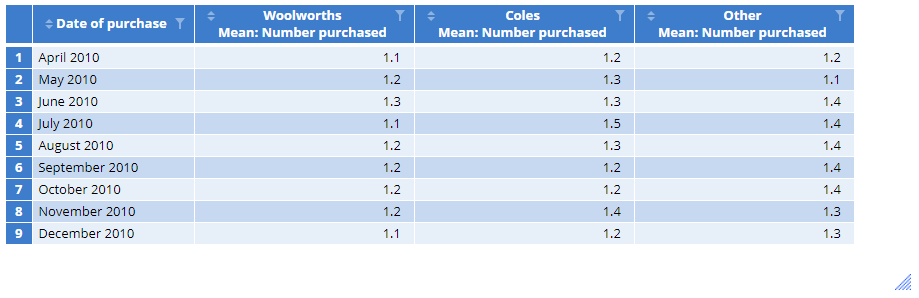
This article describes how to go from a table containing multiple variables:
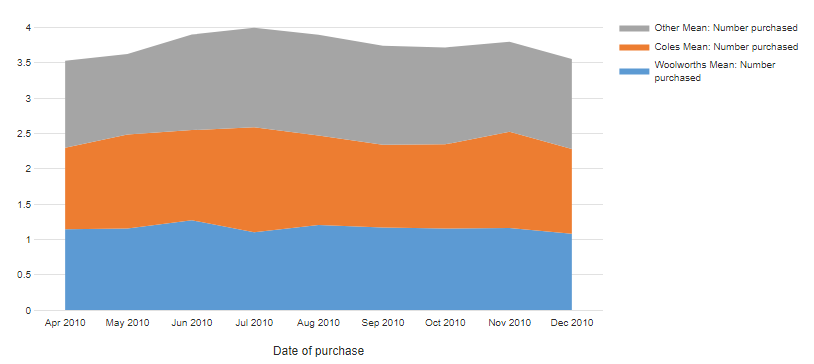
To a state where you display the table in a stacked area chart:
Requirements
- A Multiway table. To create a multiway table from the toolbar select Create > Tables > Multiway Table from the toolbar. From the object inspector, go to Inputs and select the Rows, Columns, and Numeric inputs.
- A crosstab, which is a table that shows the relationship between two or more variables.
- A table of data pasted from a spreadsheet.
Method
- Go to Create > Charts > Visualization > Area > Stacked Area.
- From the object Inspector, you have 3 different methods for providing input data to the area chart. In the DATA SOURCE section, use one of the following:
- Output - select a table output.
- Variables - select an individual variable from the Data Sets tree. Once an item is selected a second drop-down called Groups will appear in the object inspector. Here you can select a second variable to create a crosstab.
- Paste or Type data button - copy and paste data from Excel or some other source directly into a spreadsheet object in Displayr.
- From OUTPUT, tick the Stack series box.
Next