This article describes how to go from a standard table...
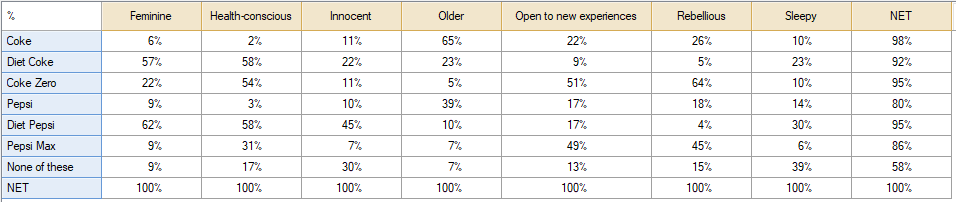
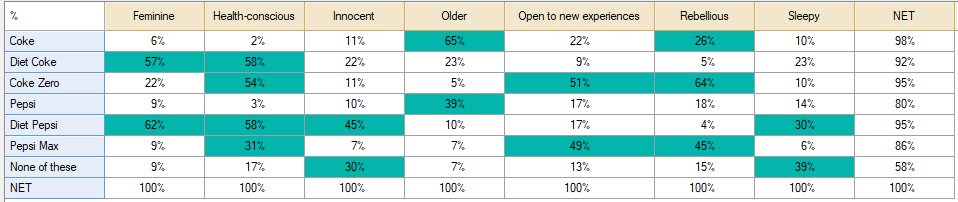
...to a table that highlights top or bottom ranked values based on value, percentage and average:
Method
1. Select your table.
2. In the toolbar go to Automate > Top/Bottom Rules.
3. Choose the desired definition: Top/Bottom 10 Items, Top/Bottom 10 % or Above/Below Average. Note, you can change the definition and value for the number of items or percentage once the dialog appears. When using the Average setting you can also specify the difference in standard deviations.
4. OPTIONAL: Update the Statistic (if different from the default).
5. Set the Color in the color picker.
6. Press OK.
7. OPTIONAL: To change the settings, right-click the rule on the Rules tab > Edit Rule.