Introduction
Sometimes it is interesting to compute the proportion or number of observations (e.g., people) that have selected one and only one option from a Pick Any question (i.e., multiple response question). If your data is not already in this format, then you should first change the Question Type (please review Help > Online Training > Manipulating Data > Questions > Multiple Response Questions if you are not familiar with how to do this).
Method
Method 1: Finding the number or percentage of people that selected one and only one category
- Go to the Variables and Questions tab.
- Right-click on an row number and select Insert Variables > Binary - Complicated Filter.
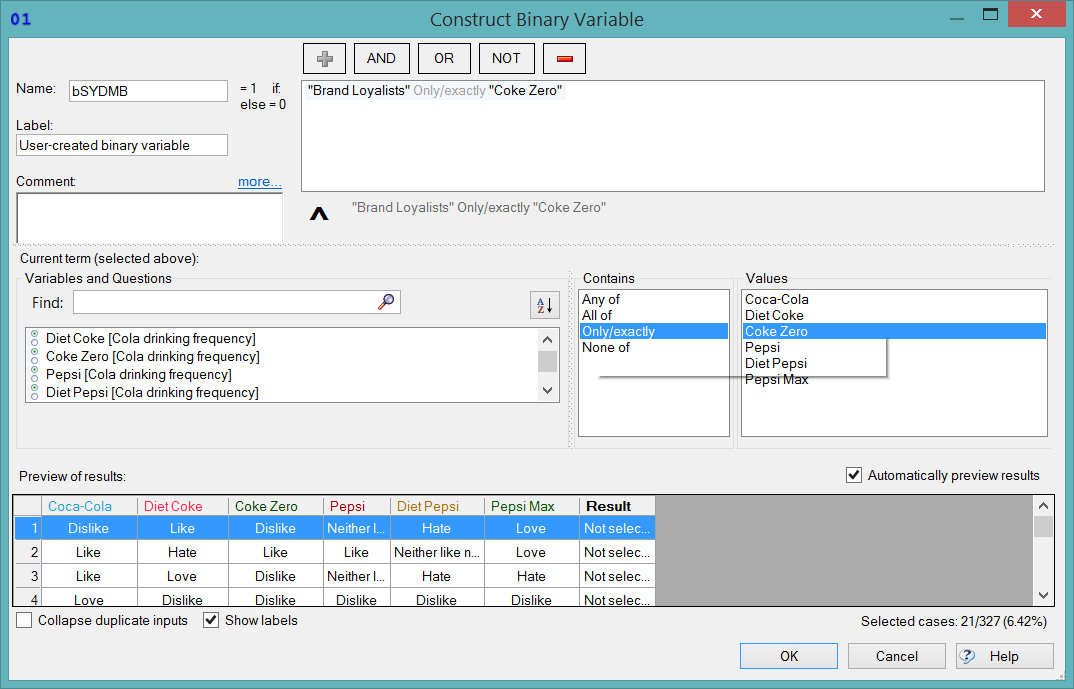
- Select the question and choose the options, as shown in the example below. (Please see Help > Online Training > Filters > Complicated Filters and Filters for more information about how to do this.)
- Fill in the Label field appropriately (e.g., Only loyal to Coke Zero) and press OK.
- Double-click on the row number of the newly created variable. This will cause it to replace whatever is currently selected in the Blue Drop-down menu.
- Right-click on the table and select Statistics - Cells > n to see the number of observations.
Method 2: Finding the number or percentage of people that selected each combination of categories
- Automate > Browse Online Library
- Type Combinations in the Find box and press the magnifying button.
- Select Multivariate - All Combinations of Pick Any Categories and press OK.
- Select the variables of interest and press OK.
- Select the table at the bottom of the Report Tree.
- Right-click on the table and select Statistics - Cells > n to see the number of observations.
NEXT
How to Add New Variables to Questions Used by Complicated Filters
How to Count Number of Selections in a Pick Any Question